Why Cycles?

Cycles are everywhere around us and the world we live in is without doubt cyclic in nature. The planets in our solar system orbit the sun, our moon orbits the earth in the lunar cycle, which causes consistent and predictable tides and seasons we experience month after month, year after year.

Humans divide their lives into time segments of days, weeks, months, years and so on. These are based upon natural cycles found in nature so it stands to reason that these cycles will present to some degree within the financial markets of world trade.

Of all the indicators, patterns and systems used to analyse world markets, the presence of relatively consistent cycles is universally agreed upon. Those cycles ‘generally’ present in the same time periods of one day, one week, one month and so on, but with some variation depending on the stock market being analysed . The following is a very simplistic synopsis of cyclic action and is solely intended to introduce the reader to the possibility of consistently tradable cycles operating in financial markets.

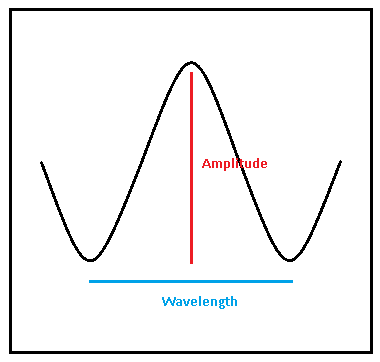
In simple terms, a cycle can be defined when a price starts low, rises smoothly and without interruption to a high, this gives a time the cycle has taken to reach its half way point. If it then descends in the same manner and in the same length of time to the low it stated from we say it has completed one cycle. If this price movement repeats its movement over the same or similar length of time it can be called a periodic cycle.

The vertical distance from the starting low to the high forms the amplitude of the cycle, in the case of stock markets this is measured in price units. The horizontal distance from the starting low to the next low in time is the wavelength. This pattern then repeats over time forming the common features of a sine wave. When analysing cycles within a particular market it is the wavelength we are particularly interested in because wavelength in financial markets is measured in time.

‘The sine wave is important in physics because it retains its wave shape when added to another sine wave of the same frequency and arbitrary phase and magnitude. It is the only periodic waveform that has this property. This property leads to its importance in Fourier analysis and makes it acoustically unique.’ – wiki

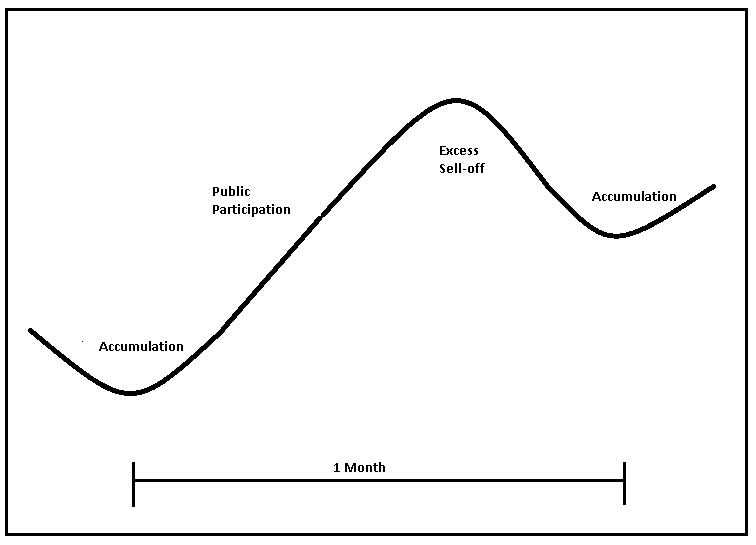
Any particular cycle in a given market will have three distinct phases. The first being the accumulation phase where the cycle is turning to rise to a price increase, generally recognised where professionals commit their money because the issue is considered undersold/undervalued. The second being the public participation phase, were there is sufficient volume of traders to cause price to rally. After this comes the excess phase, whereby the value of the equity is considered overbought/overvalued and so follows a sell off causing price to fall to another low and thus completes one cycle. The process then begins again with a new accumulation phase.

Imagine a cycle of one day or 24 hours; let’s think how the cycle movement would form. The Asia-Pacific Markets open on the morning in their time zone, overnight orders are filled and trading decisions are made and the volume moves the market. As the Asia-Pacific markets come towards the end of their trading day, volume tends to tail off and the cycle flattens, however the European markets open and start their trading day injecting volume into the market and it subsequently moves. Lastly the US markets opens as Europe tails off, before they flatten and close before the whole process starts again. The resulting effect on a stock chart looks similar to figure 3.

The key to successful trading is to enter a long positon during the accumulation phase and exit just before the excess phase takes effect. Conversely, successful short trades must be entered during the excess phase, just prior to the sell-off taking effect, and then exited before a new accumulation phase begins. Sounds simple enough but identifying the correct cycle to trade and recognising the phase that is presenting is paramount to achieving consistent success.

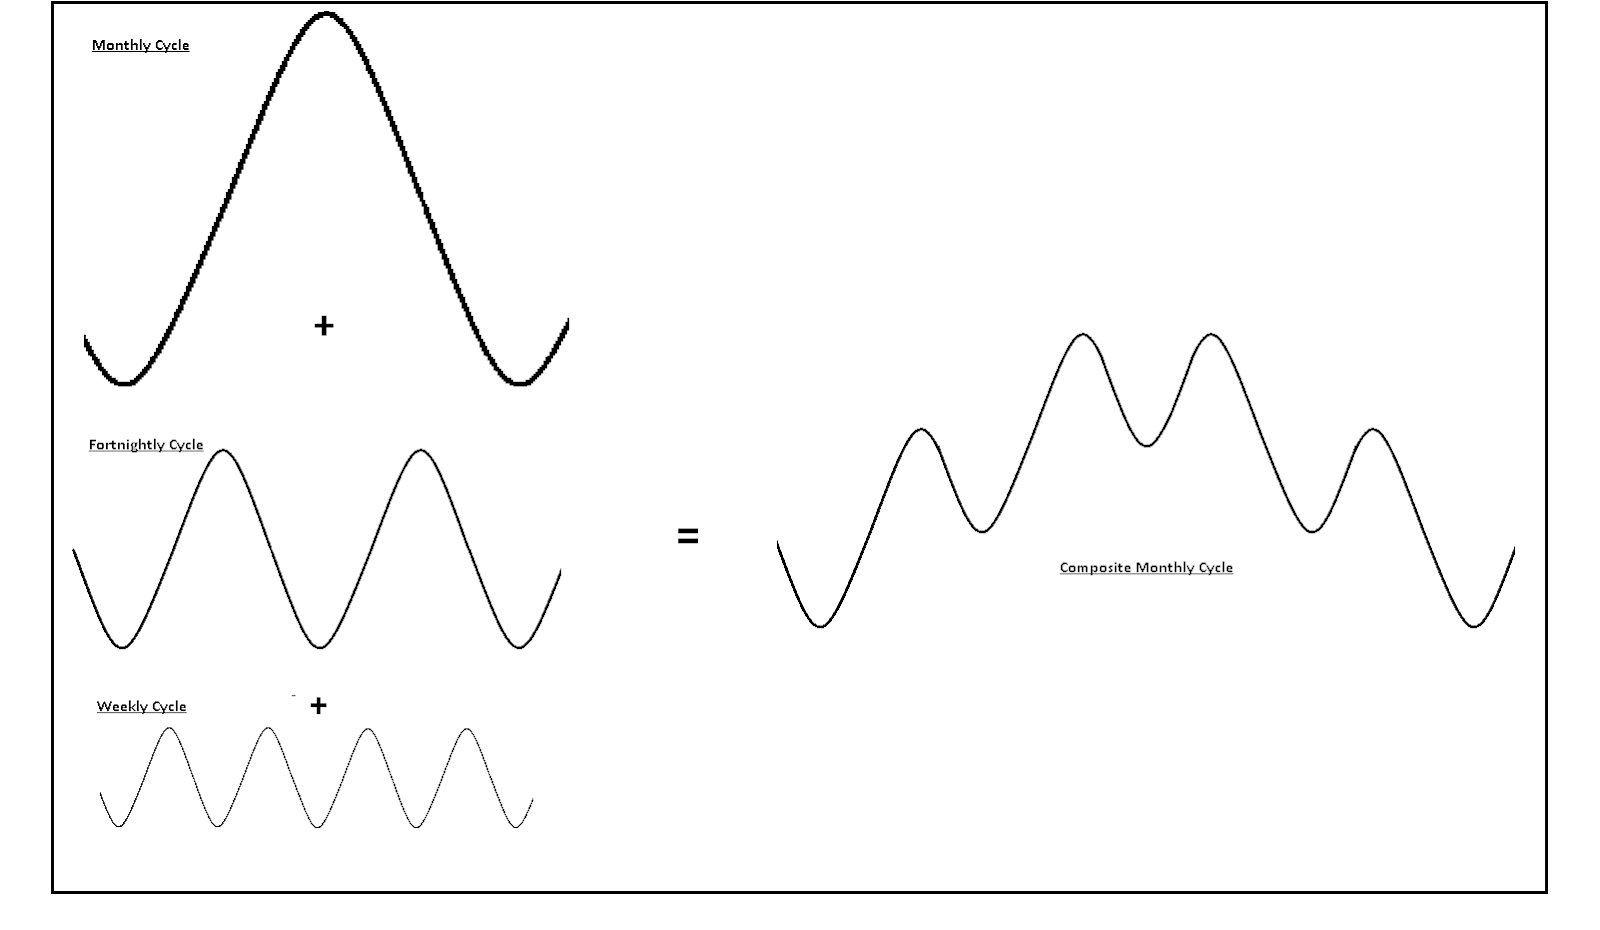
Now imagine three cycles of different wavelengths present in a theoretical ideal market, a daily, fortnightly and monthly cycle. Assuming the lows of each cycle line up in the same place in time we can add the respective waves at any given point in time to form a composite wave which is much more familiar to anyone who has studied even basic charting.

Theoretically there are an infinite number of larger (seasonal, political) cycles and smaller (intraday) cycles all combining together to form the price fluctuations we see in the stock markets. Combine this with the influence of daily news events and the process of identifying particular cycles becomes much more complex, but they ARE there!

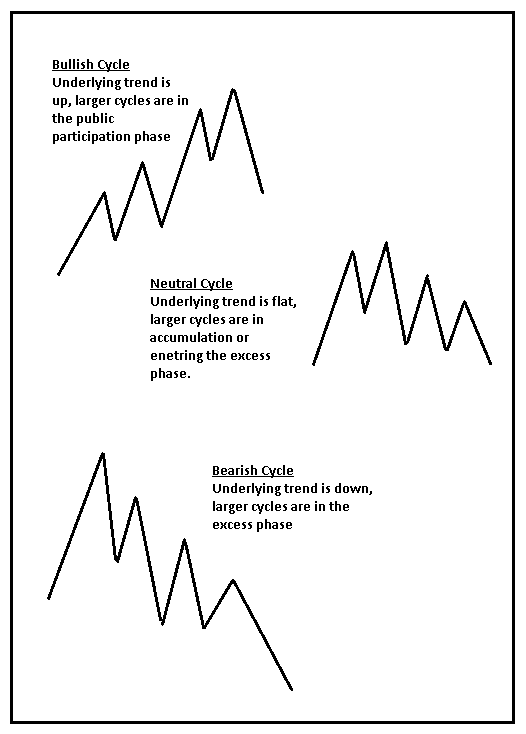
The overall shape of any cycle will depend on where it lays within the larger cycles.

Furthermore, by breaking the market down into cyclic elements we can see how they form the basis for some of the most trusted chart shapes and analytical tools, such as double tops/bottoms, head and shoulders, Flags, triangles, pendants, trend lines and channels.

As mentioned at the beginning, this was merely intended to be an introduction into the possible cyclic motion of price in stock markets. For a more comprehensive approach to stock market cycles, the reader is directed to any text by J M Hurst.